The Challenge
When I stepped into the responsibility of supporting marketing for 350+ active and in-development communities, the biggest obstacle wasn’t strategy, staffing, or budget.
It was data.
Every meaningful task—creating listings, launching ads, answering customer questions, building reports, or supporting leasing teams—required hunting for information across a maze of disconnected systems. One set of property details lived in a spreadsheet. Another set lived in a database (if that databased was updated, if not, you might find the info on the shared drive). Ownership info? Sorry, you’ll have to talk to another department. Photos were spread across the internet and thumb-drives stashed in random desks. Making things worse, much of the data conflicted, was outdated, or simply didn’t exist.
After 35 years of growth, the company had accumulated hundreds of properties’ worth of knowledge—but without a single reliable source of truth, that knowledge was effectively unusable.
The organization wasn’t short on information; it was short on consistency and structure.
The Solution
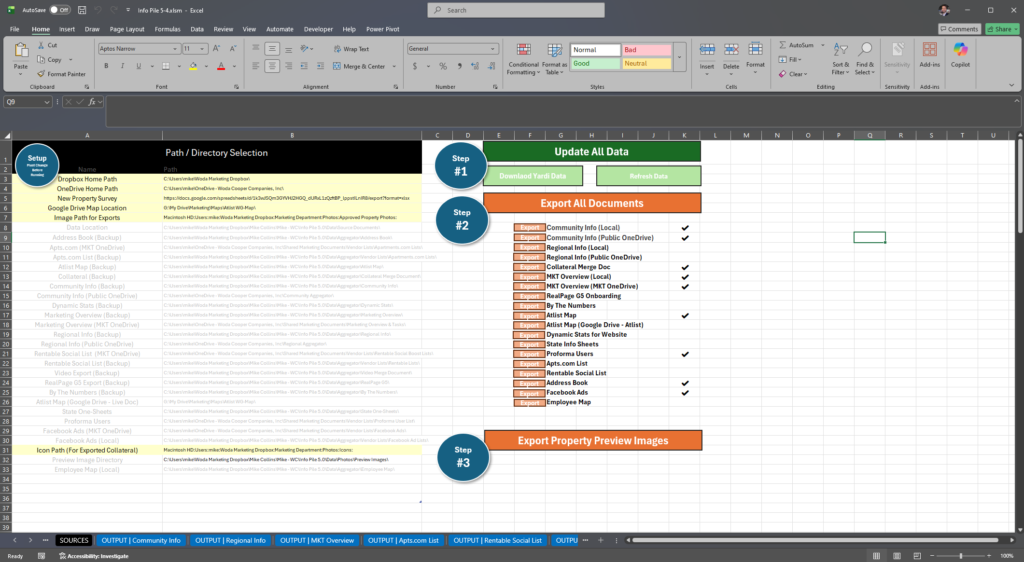
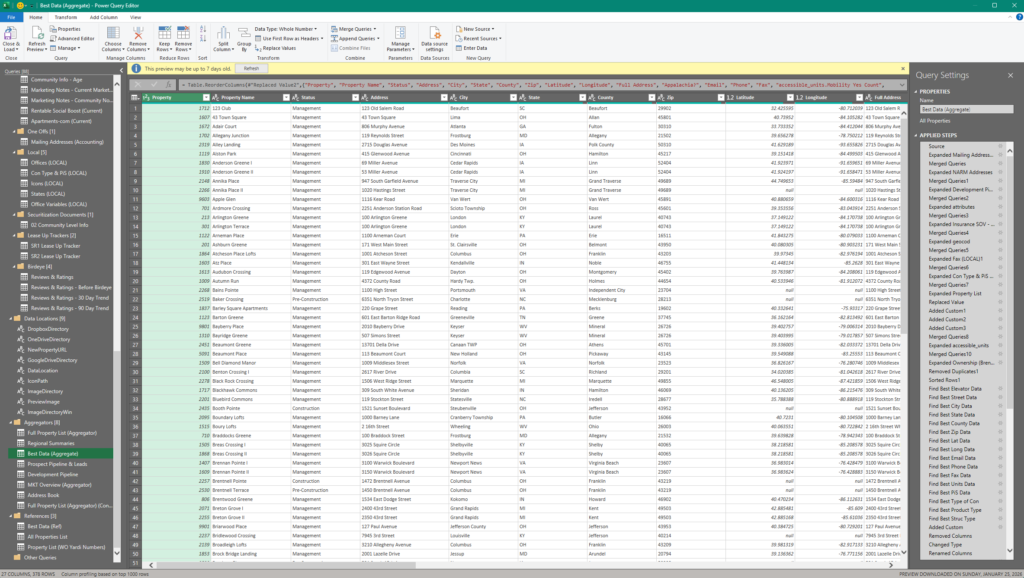
To solve this, I created a project I lovingly called “The Data Pile.”
Its purpose was simple but ambitious: to bring everything we knew about every community into one place, make it reliable, and most importantly: make it automated. Because it’s easy to complete a massive project but if the solution isn’t structured for scale and automation after the fact, it will quickly become as outdated and useless as the sources it sought to replace.
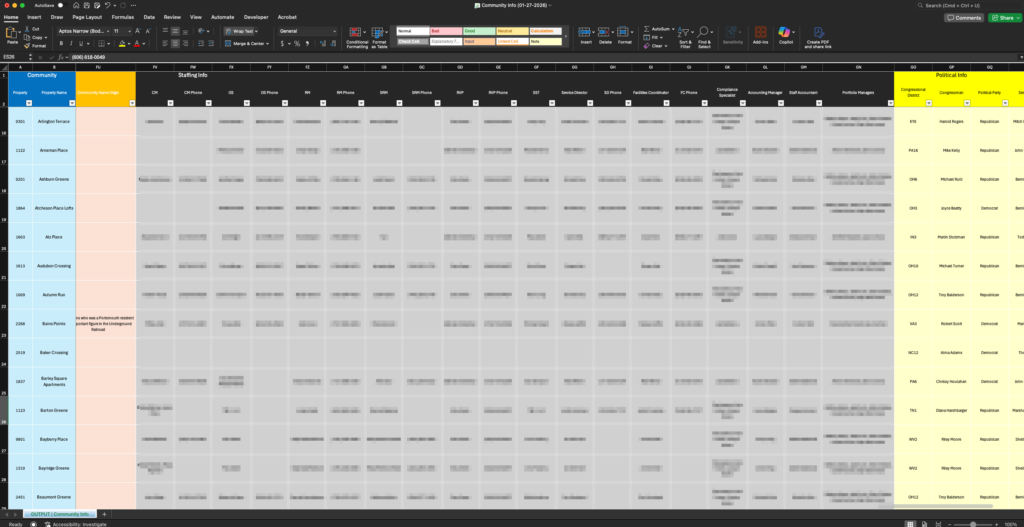
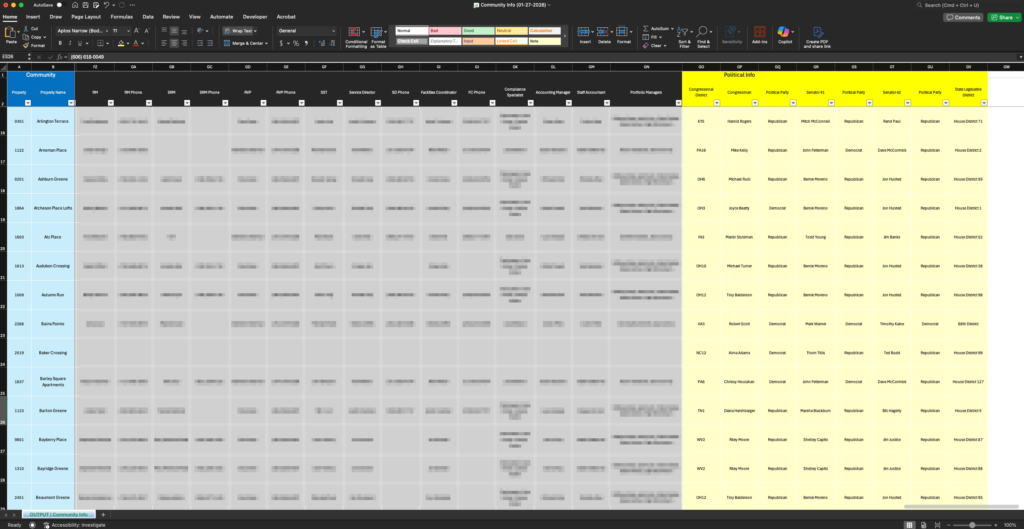
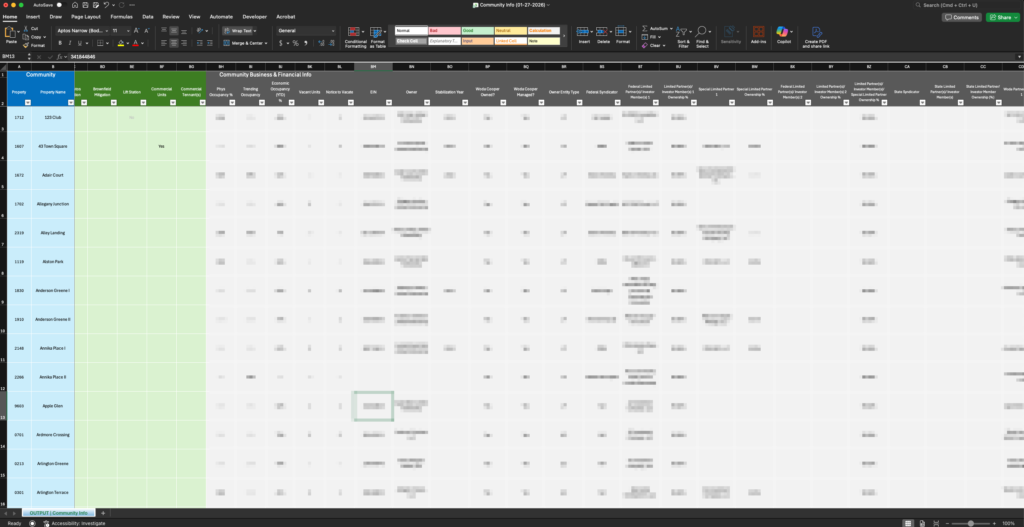
I built a system that conditionally aggregated data from more than 40 internal and external sources, weighting some sources more heavily than others, flagging conflicts, identifying missing fields, and organizing everything into a structured, queryable format. These sources included database SQL reports, Sharepoint files, shared reports, online platforms, and lots of random spreadsheets.
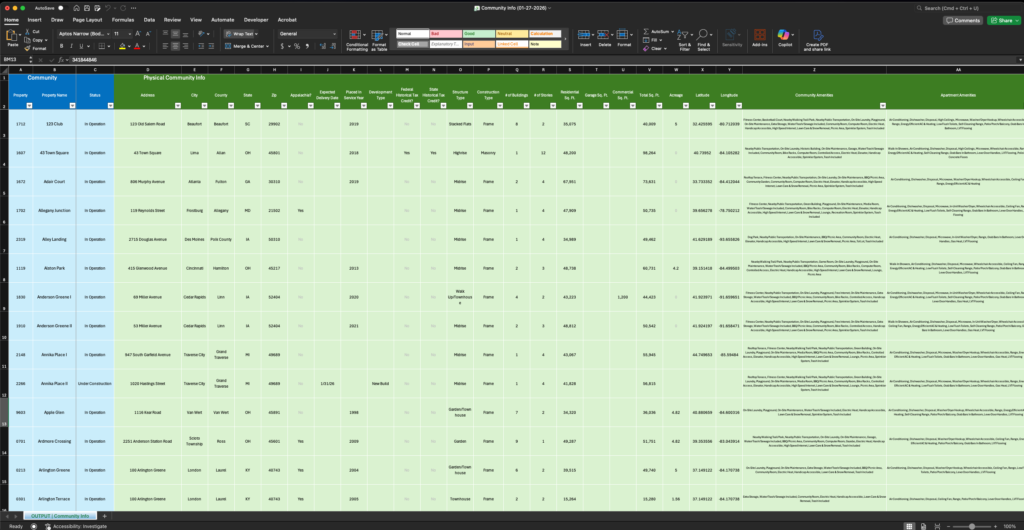
What emerged was not just a spreadsheet, but a living database of the entire company’s portfolio.
For each community, it included:
- Physical and structural details
- Ownership and financial information
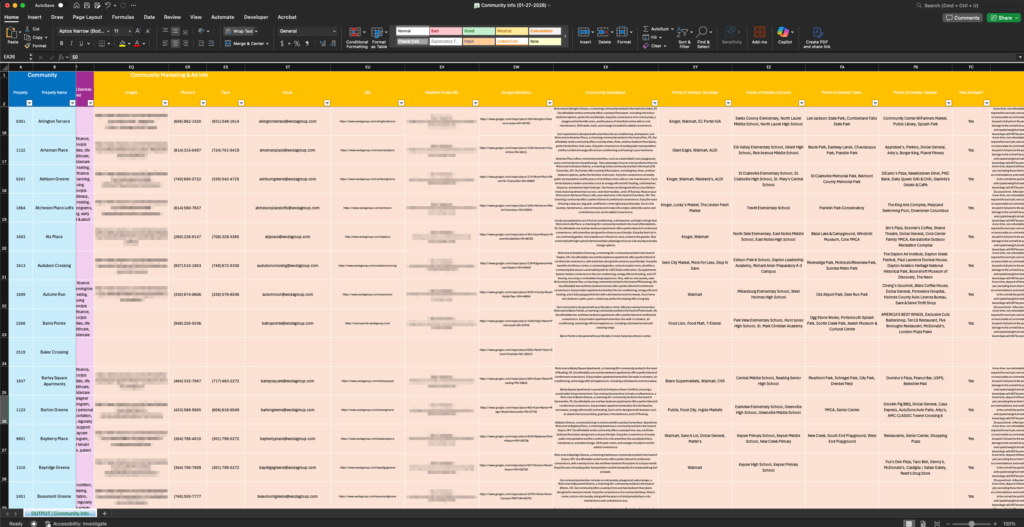
- Marketing content (photos, copy, amenities, contact info)
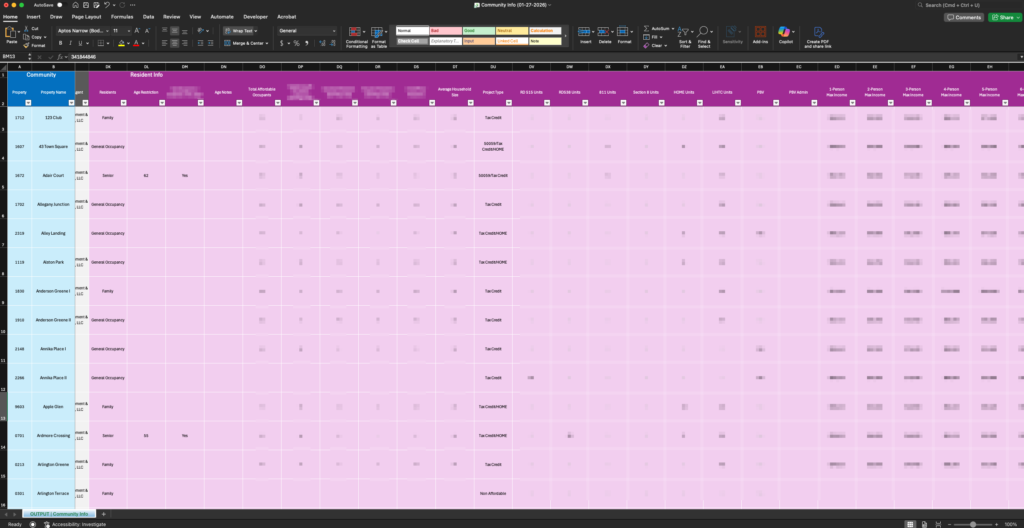
- Resident and demographic data
- Staffing and management details
- Nearby points of interest
- Market and neighborhood context
For the first time, we could see the company clearly—property by property, region by region, and as a whole.
The Evolution
Once the system was automated and the data was structured, everything changed.
Instead of spending time hunting for information, I could finally start building tools that had never been possible before—using Python, AI, InDesign and Premiere scripting, and live data pipelines.
From that foundation, I built:
- A company-wide community report that gave every department access to the same trusted data I was using—continuously expanding it based on feedback from other teams
- A real-time regional reporting system that summarized units, construction types, awards, and demographics by city and state—replacing reports that previously took months and were only run once or twice per year
- A marketing-priority algorithm that went beyond lead volume, factoring in occupancy trends, review sentiment, and lead quality to identify properties at real risk
- Automated listings across Apartments.com, Zillow, and other platforms based on those priorities
- Automated task reminders for my staff, generating detailed to-do lists driven by live company metrics
- Fully automated Facebook and Google ad campaigns
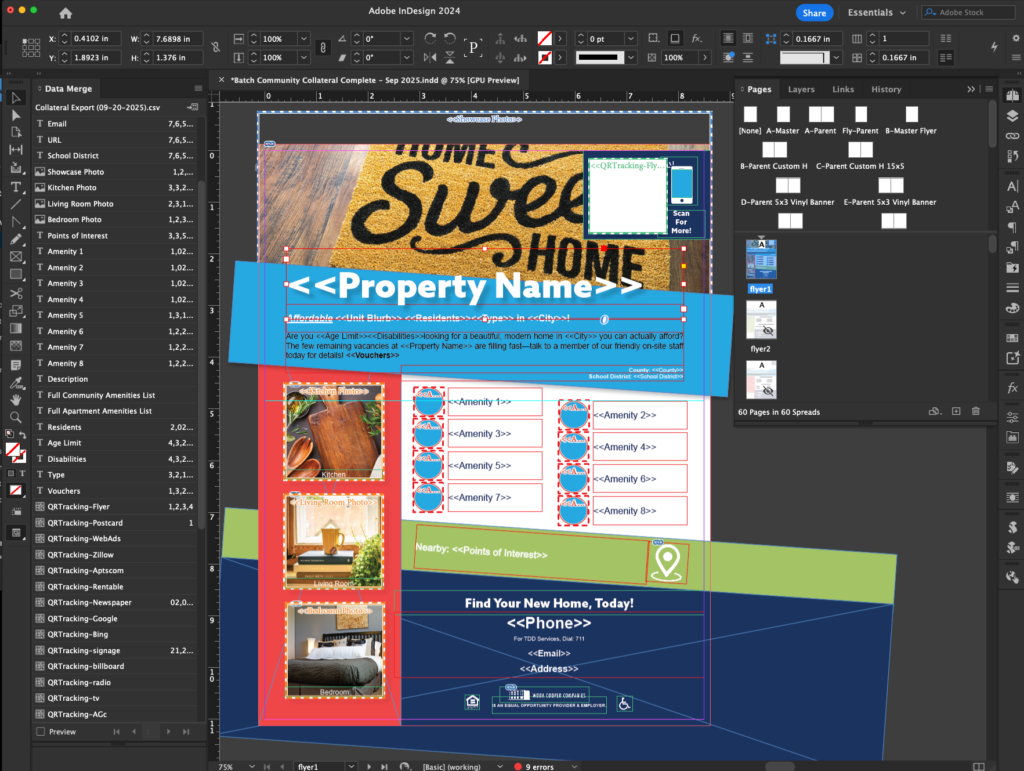
- A creative engine that produced hundreds of flyers, banners, signage, postcards, and newspaper ads at once
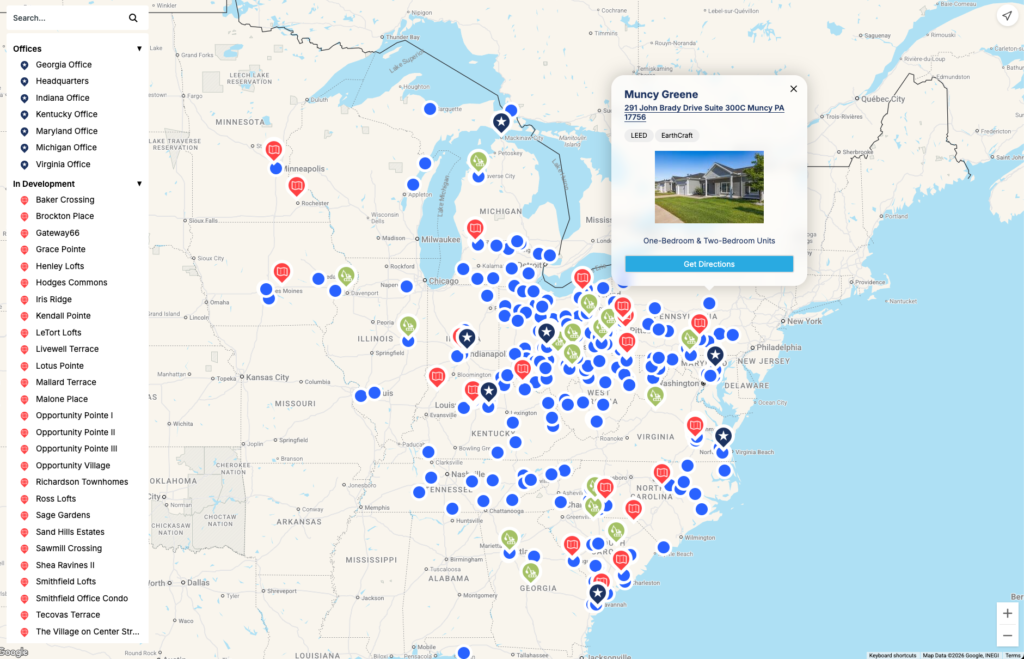
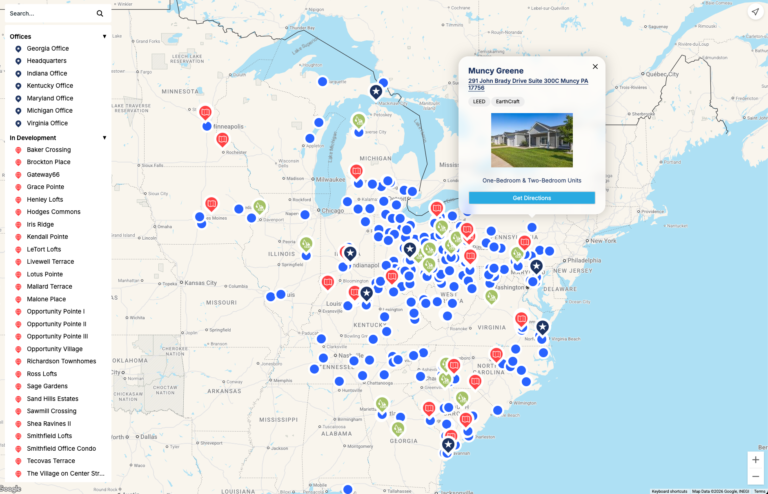
- A live property map showing every community in the portfolio
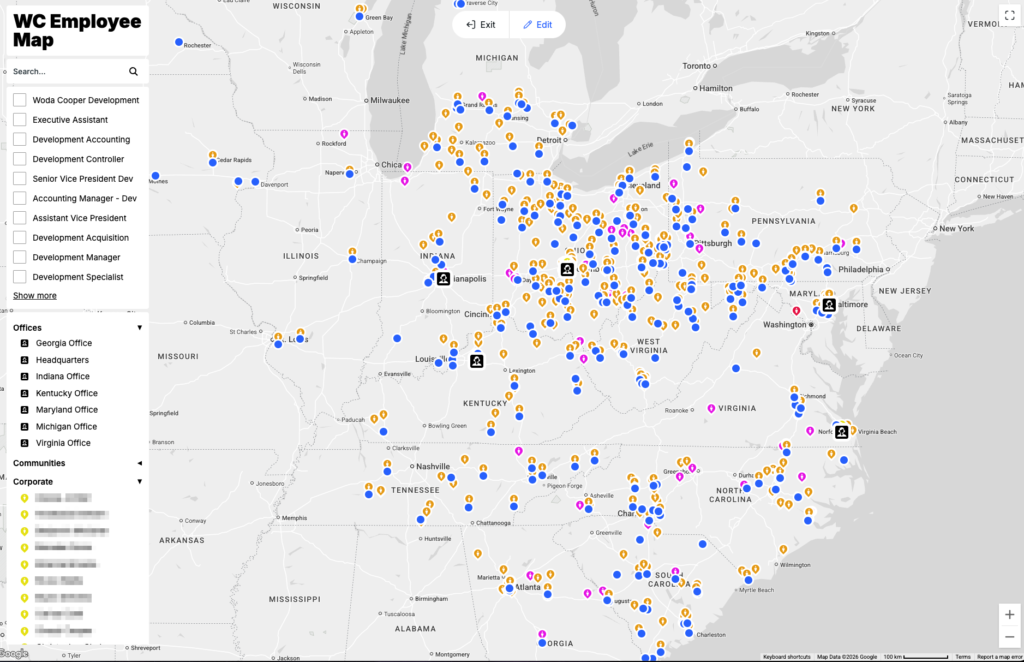
- A live employee map used for organizational planning and restructures
- A company-wide metrics plugin that kept leadership dashboards continuously updated
- A constantly refreshed executive address book containing every employee, community, and development project
- And even a system to identify and send holiday gifts to at-risk residents as part of our charitable Christmas program
Why It Mattered
What started as a messy collection of disconnected records became a backbone of how the company understood its data.
The Data Pile didn’t just save time—it changed how decisions were made, how teams worked together, and how accurately leadership could see the business in motion.
By turning scattered information into a shared source of truth, I was able to unlock automation, insight, and scale in ways that simply hadn’t been possible before.
Was creating the Data Pile a cumbersome project?
Yes.
Would I do it again?
Absolutely! Even if it took twice as long with half the results, it would still be a spectacular success.
Gallery